Analysis and Results
Genetic characteristics and natural selection
Numerical characteristics: agility, bigness, speed, fertility
We saw that with time there is a natural selection between the creatures, and consequently their characteristics evolve: all numerical genes converge on a certain value, and the percentile distribution of values decreases.
From an evolutional point of view, creatures tend to develop their speed (faster creatures can reach more quickly food, even if it is more distant) and become at the same time bigger, to eat more food each time. Because of faster creatures have a greater survival ability, the speed-graph clearly increases.
On the contrary, the bigness-graph shows a relevant decrease at the beginning of the simulation. This is caused by the fact that bigger creatures are slower (as it can be seen in the equation: speed= agility/bigness) and so are disadvantaged. However, bigness values do not drop under a certain level, because bigger creatures can eat more food in the chunks.
Fertility generally increase with time, even if it represent the minimum number of ticks that there must be between two consecutive reproductions. This is explained by the fact that creatures with a greater value of fertility need less food to reproduce themselves, because this is inversely proportional to the gene itself.

Speed gene variation over time
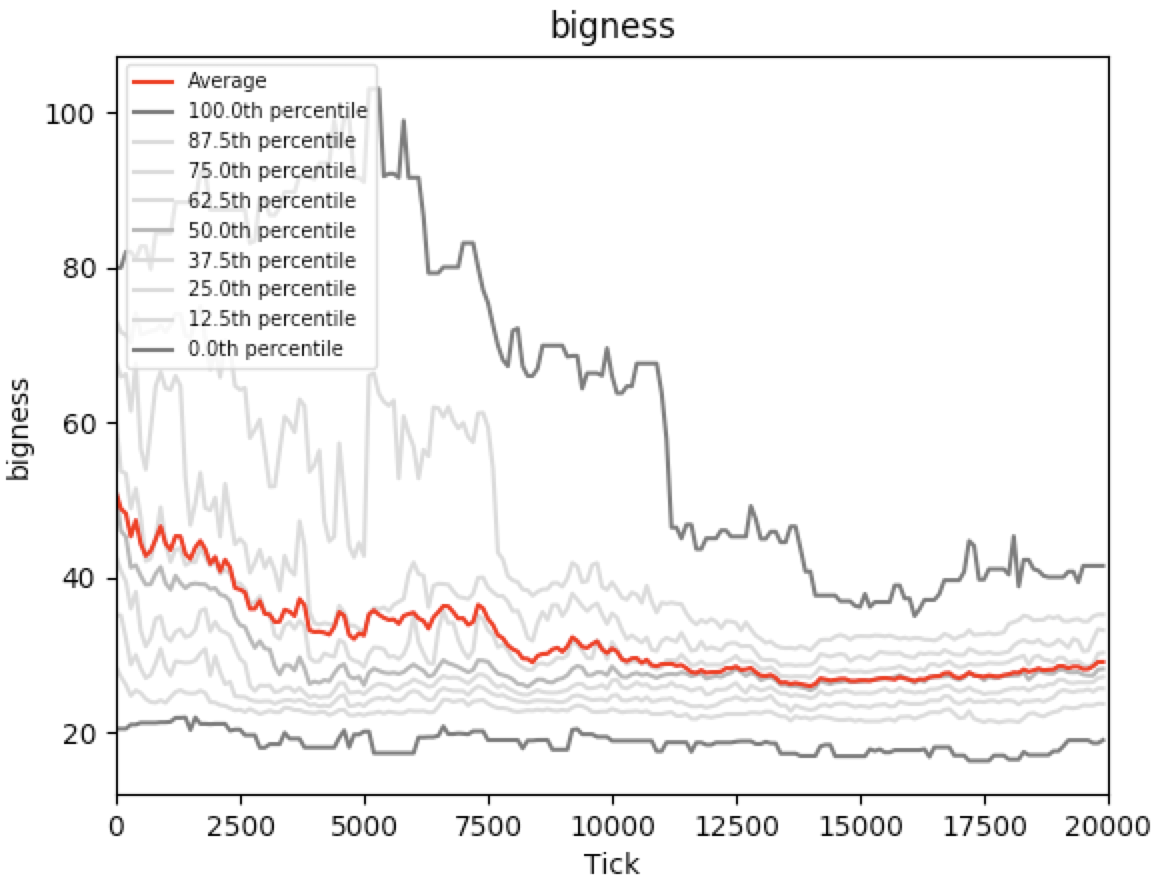
Bigness gene variation over time
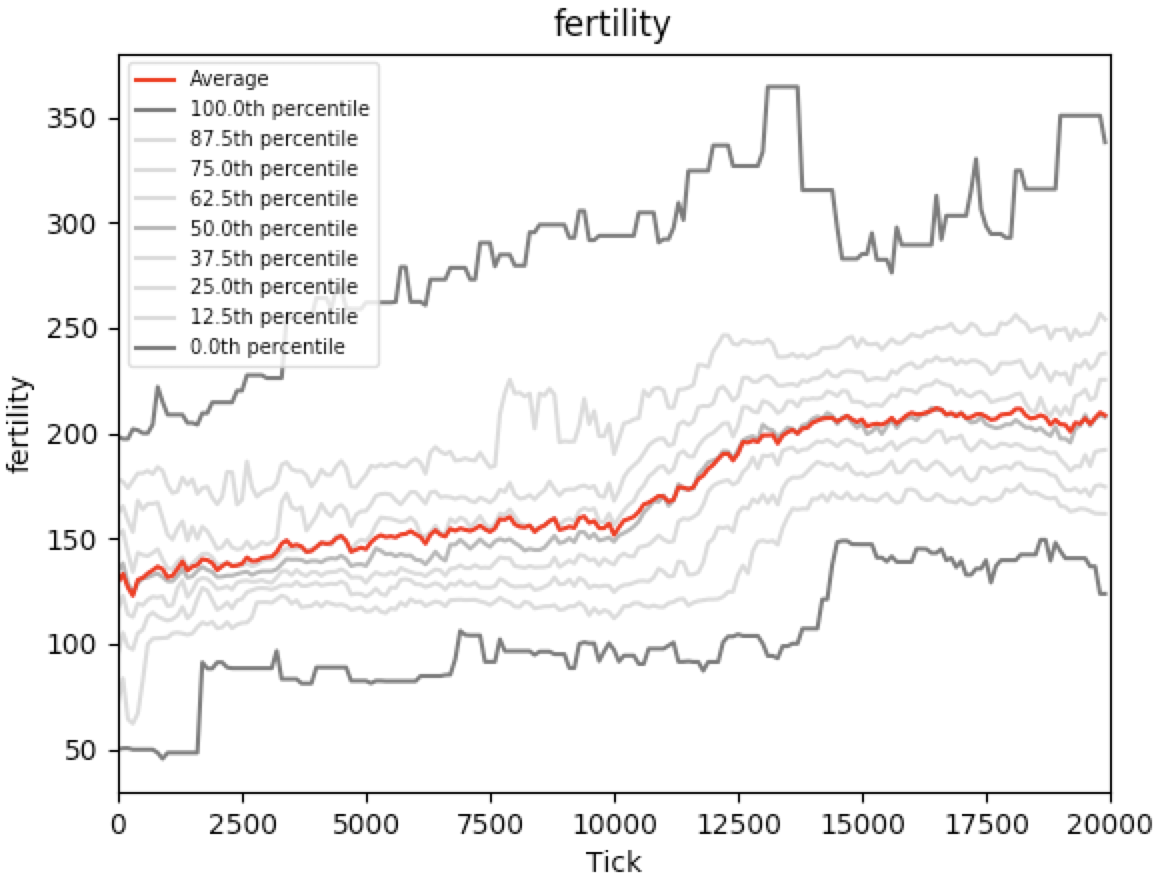
fertility gene variation over time
Mendelian characteristics: temperature resistance
We divided the territory into 8 classes of climatic frequency e we studied how many creatures were in each class, drawing the graphs for each temperature phenotype (c, l, N). Each bracket is coloured with 8 different shades from red (hot climate) to blue (cold climate).
It has been observed that creatures with c phenotype, that are fitted for hot climate, usually placed in hotter chunk; on the contrary creatures with l phenotype placed in cooler ones. The others (N, n) lived in intermediate zones. Figure shows the climate map of the territory and the disposition of coloured creatures coherently with their phenotype.
The division of creatures based on temperature can be considered a sort of allopatric speci- ation, because, even if in theory able to reproduce themselves, a creature with c phenotype and a creature with l phenotype cannot meet each other, because living in temperature-conflicting zones.
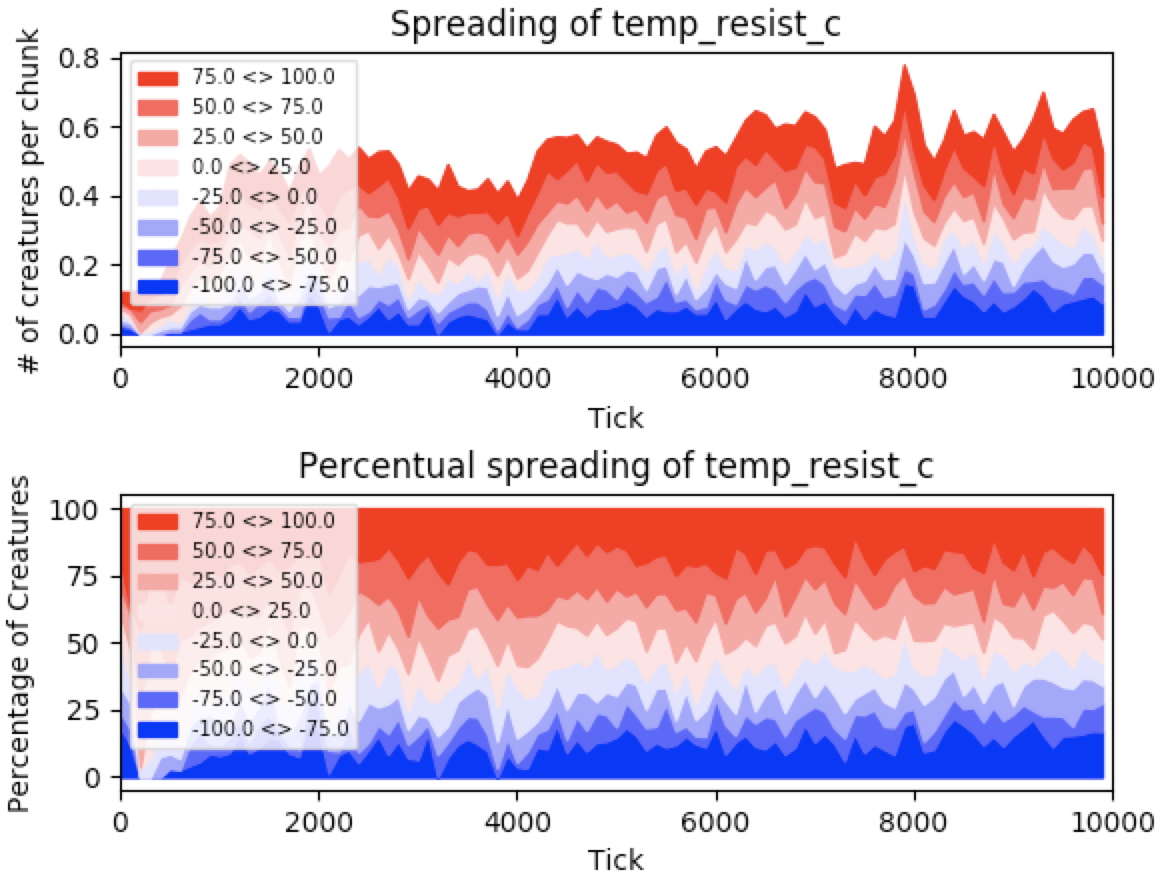
Distribution of creatures considering c phenotype
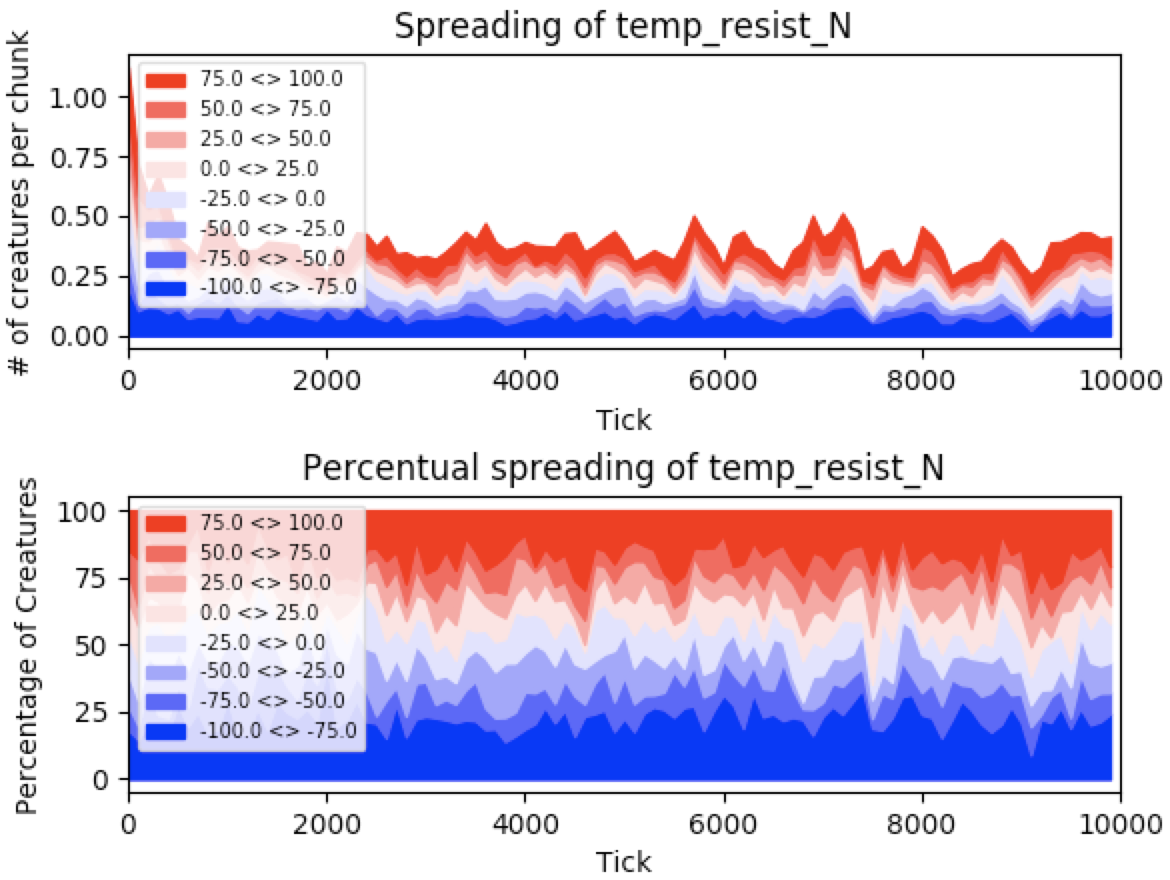
Distribution of creatures considering N phenotype
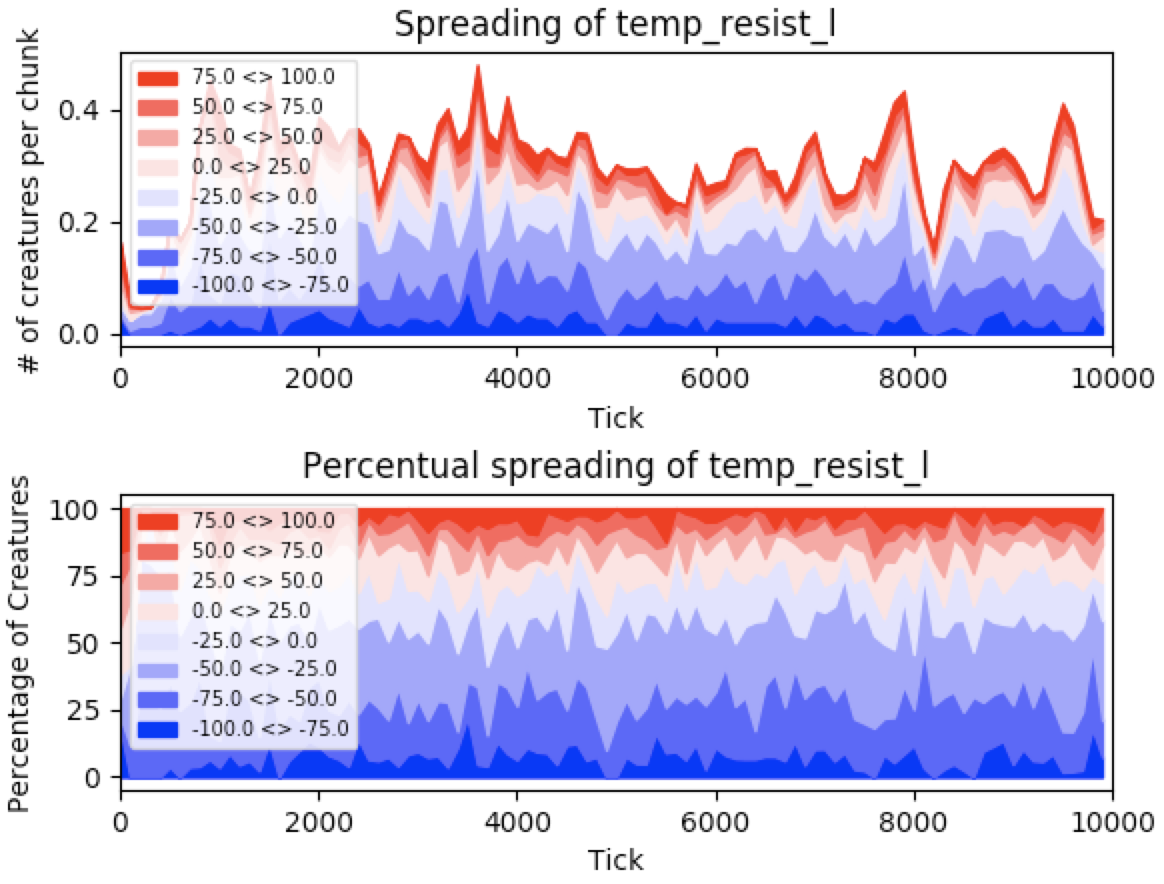
Distribution of creatures considering l phenotype
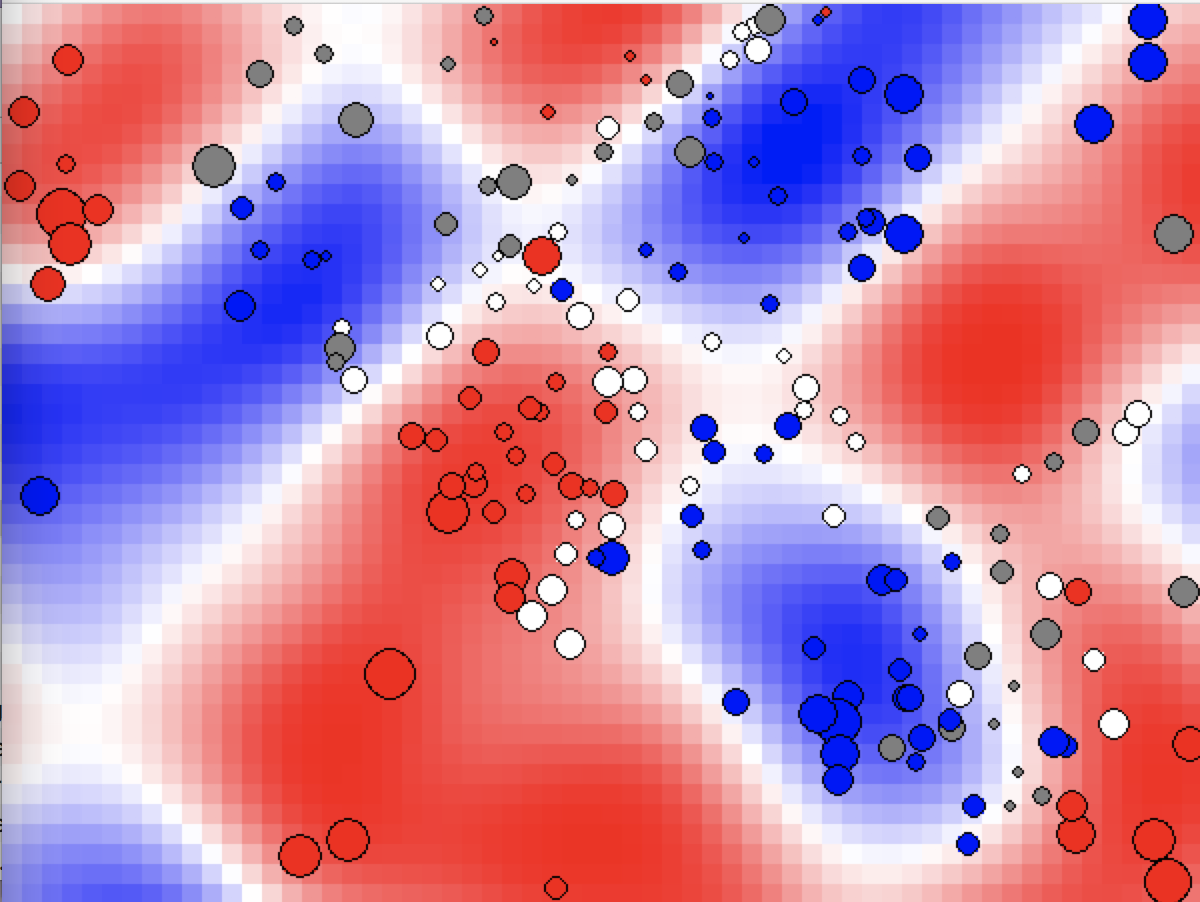
Image of an istant of the simulation considering temperature (1)
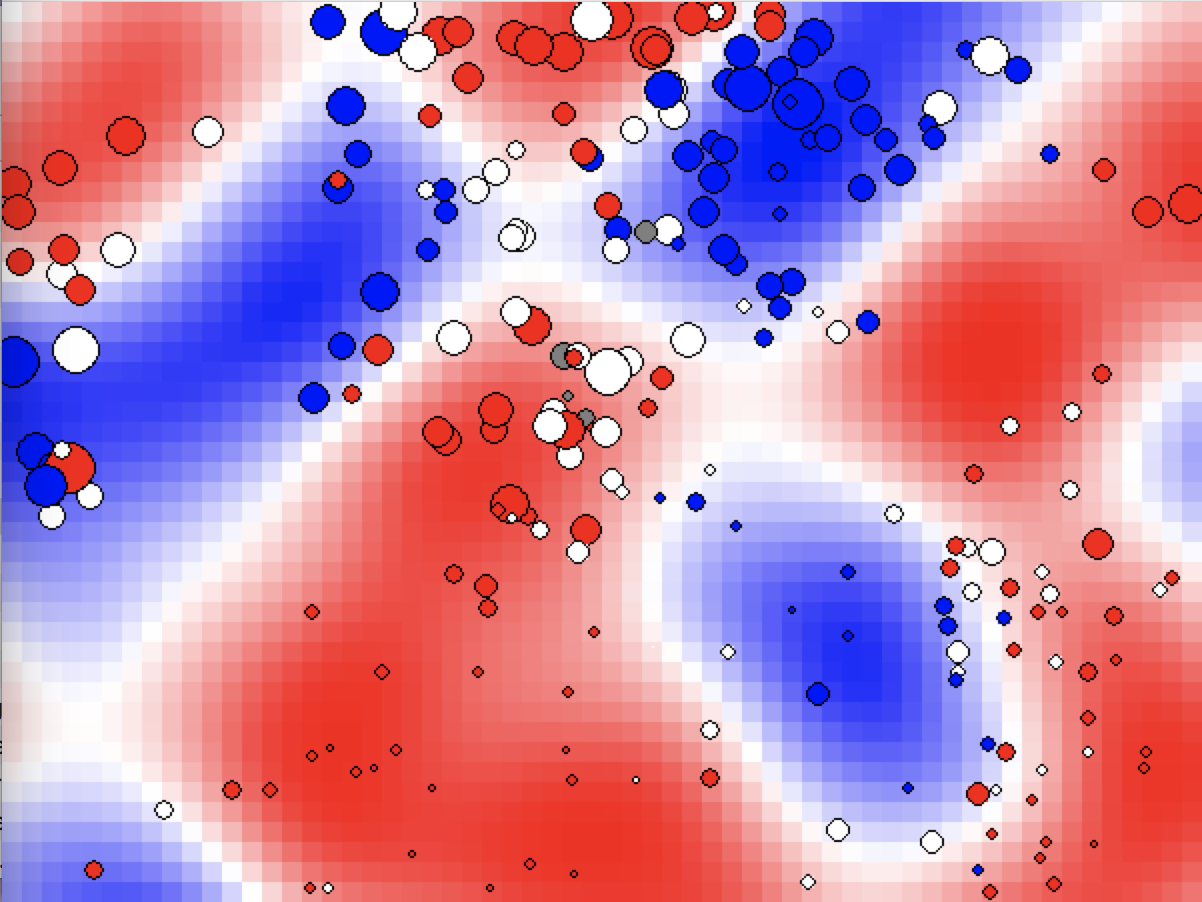
Image of an istant of the simulation considering temperature (2)
Control-genes: Hardy-Weinberg principle and Genetic Drift
A different discussion mast be done with the two genes that have a control function with no phonotypical effects.
The numerical gene numcontrol has not a univocal behaviour (always increasing, decreasing or constant), but varies in each simulation.
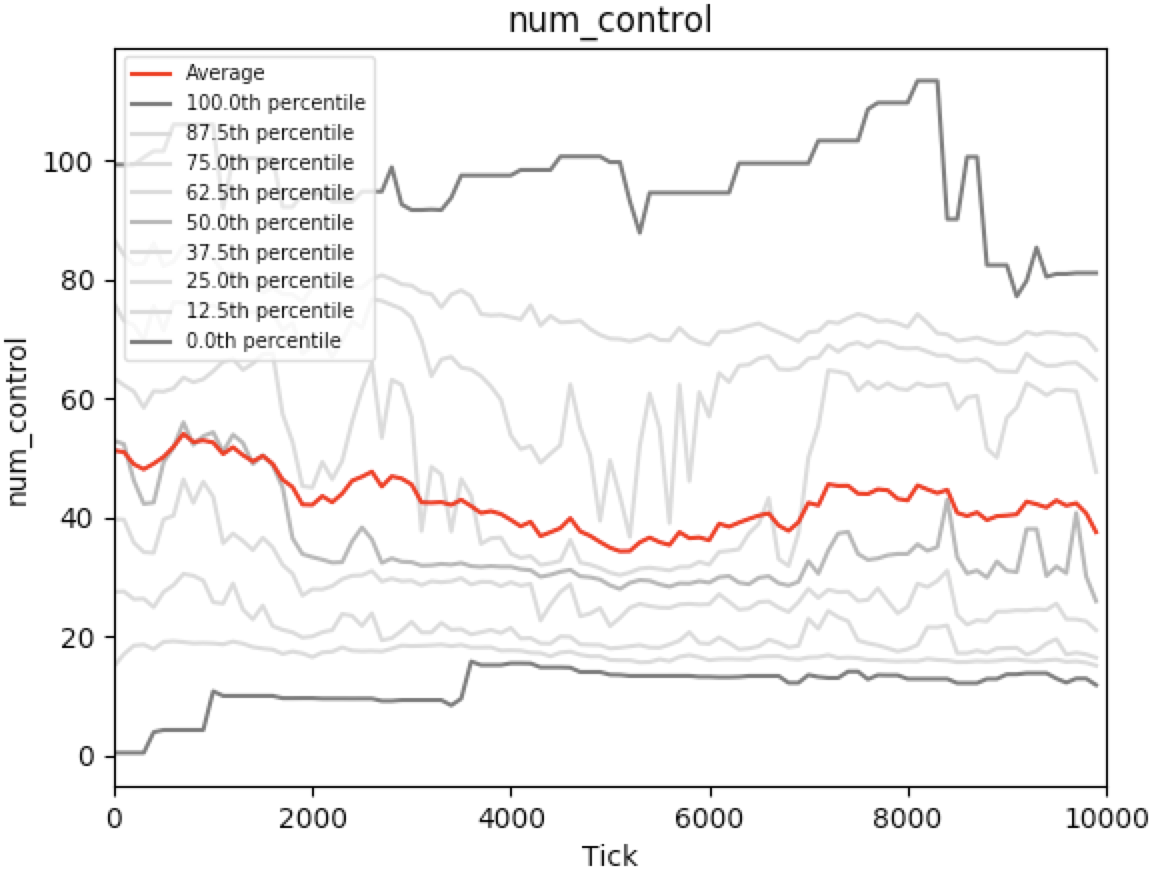
num_control gene variation over time (1)
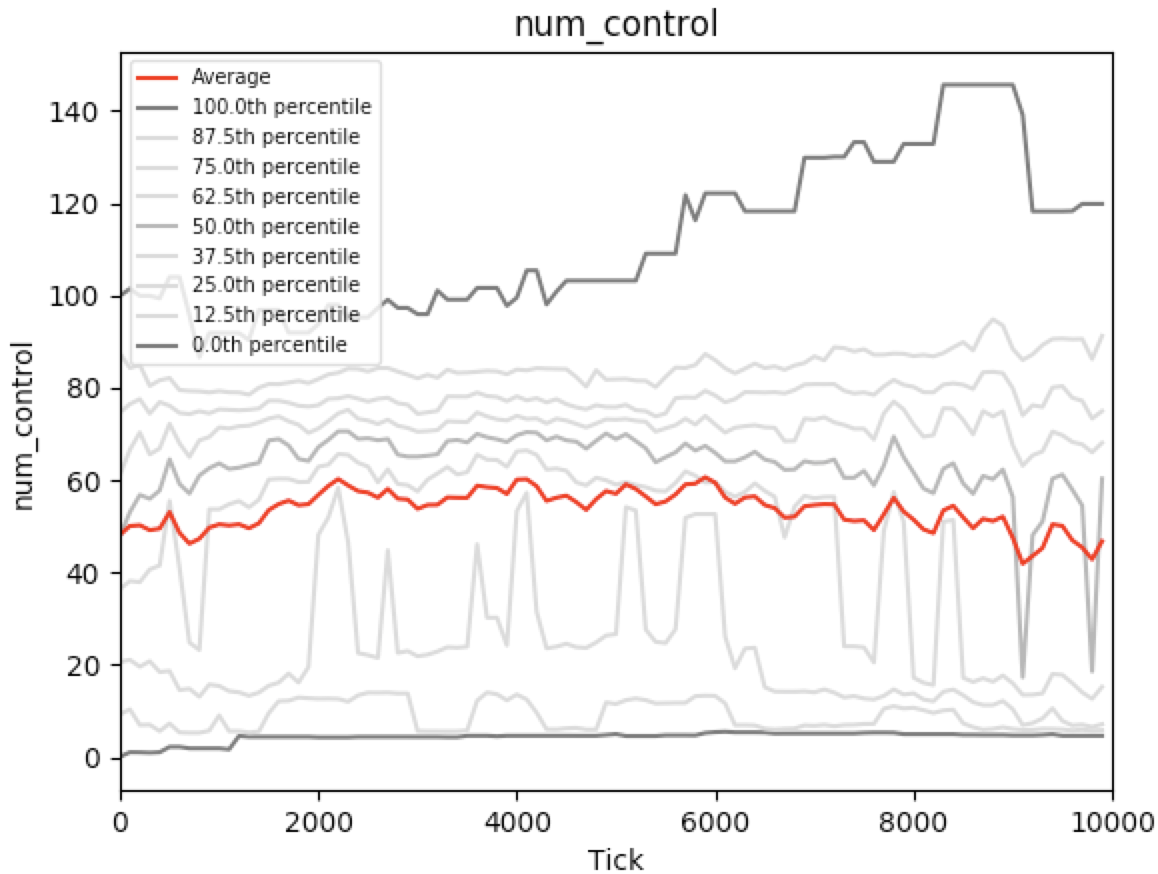
num_control gene variation over time (2)
Moreover there is no reduction of the percentile distribution as in other numerical genes. Considering the Mendelian gene mndlcontrol, it can be observed that its distribution in the territory is homogeneous on temperature varying, for both the two phenotypes, A dominant and a recessive, as in Figure. We also controlled if it respected the Hardy-Weinberg principle. The condition for this equilibrium are: no mutations, casual reproduction, a big population, no gene flow and absence of natural selection with that gene. We saw that this character does not respect this equilibrium, because of the small population (only 150 creatures in the world) and the unstable trend due to the random food consumption in some of the areas at certain ticks. We can say that this character is subjected to a genetic drift.
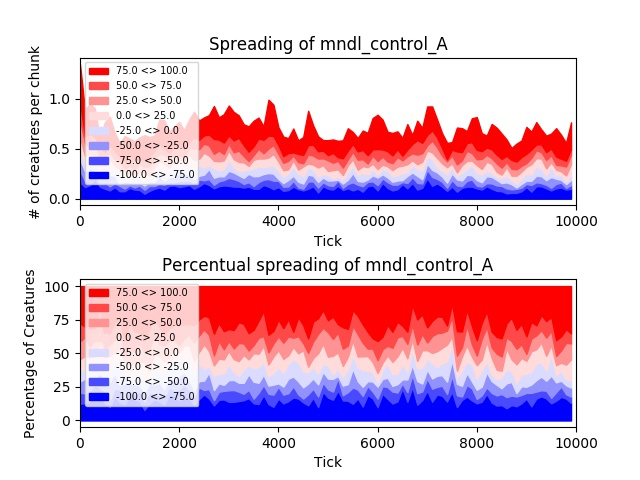
Distribution on the world considering the mendelian gene of control (dominant phenotype)
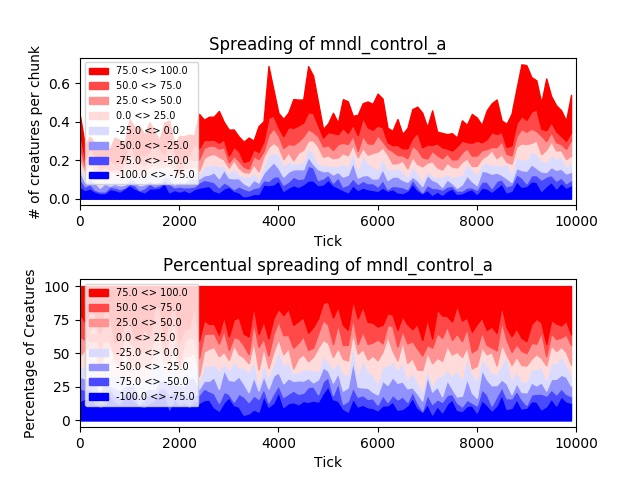
Distribution on the world considering the mendelian gene of control (recessive phenotype)
Territory distribution of creatures considering the food
As we did for temperature, we divided the territory into 8 classes of foodmax quantity in each chunk. We represent the graph with the number of creatures for each class over time. We coloured the brackets with 8 different shades: darker ones has less food, lighter ones has more.
The graph in Figure 11 shows that creatures are generally in lighter brackets. Figure shows the distribution of creatures on the territory in a certain tick.
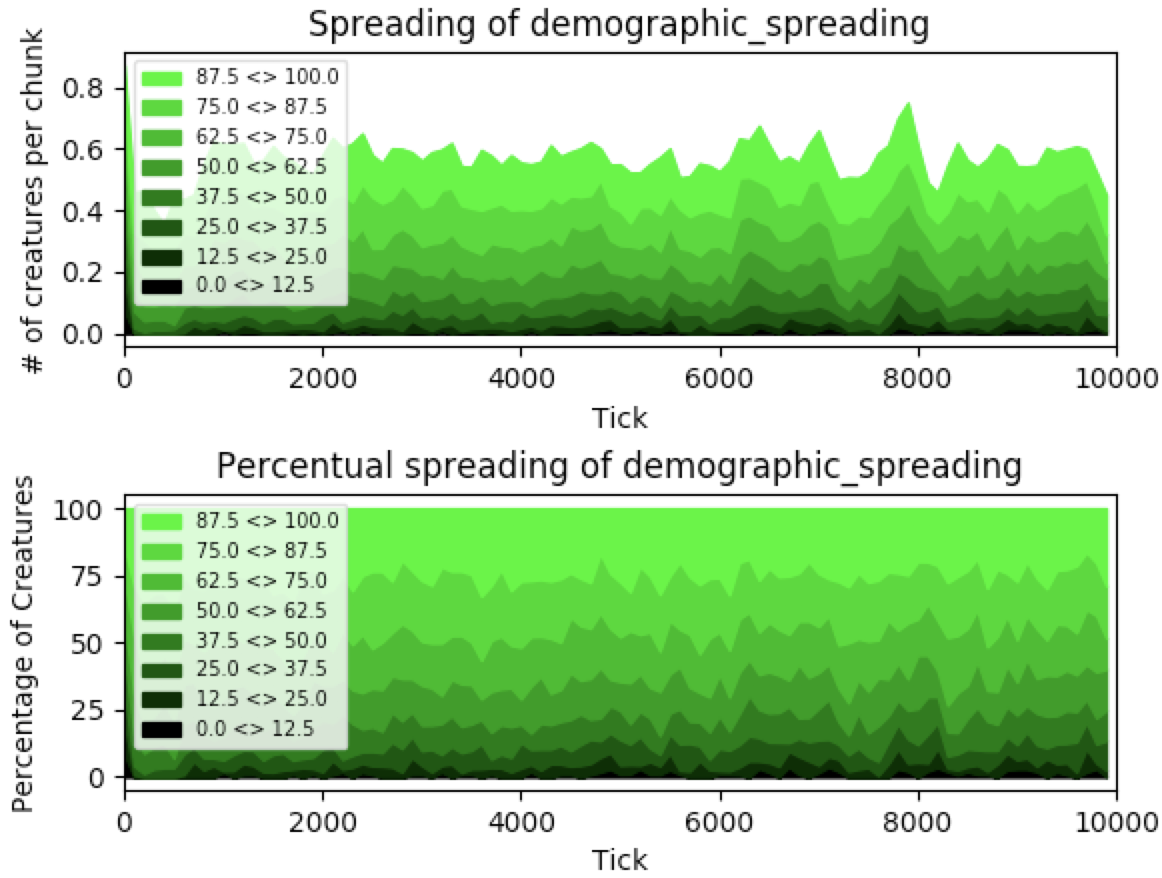
Distribution of the creatures in the world considering the quantity of food
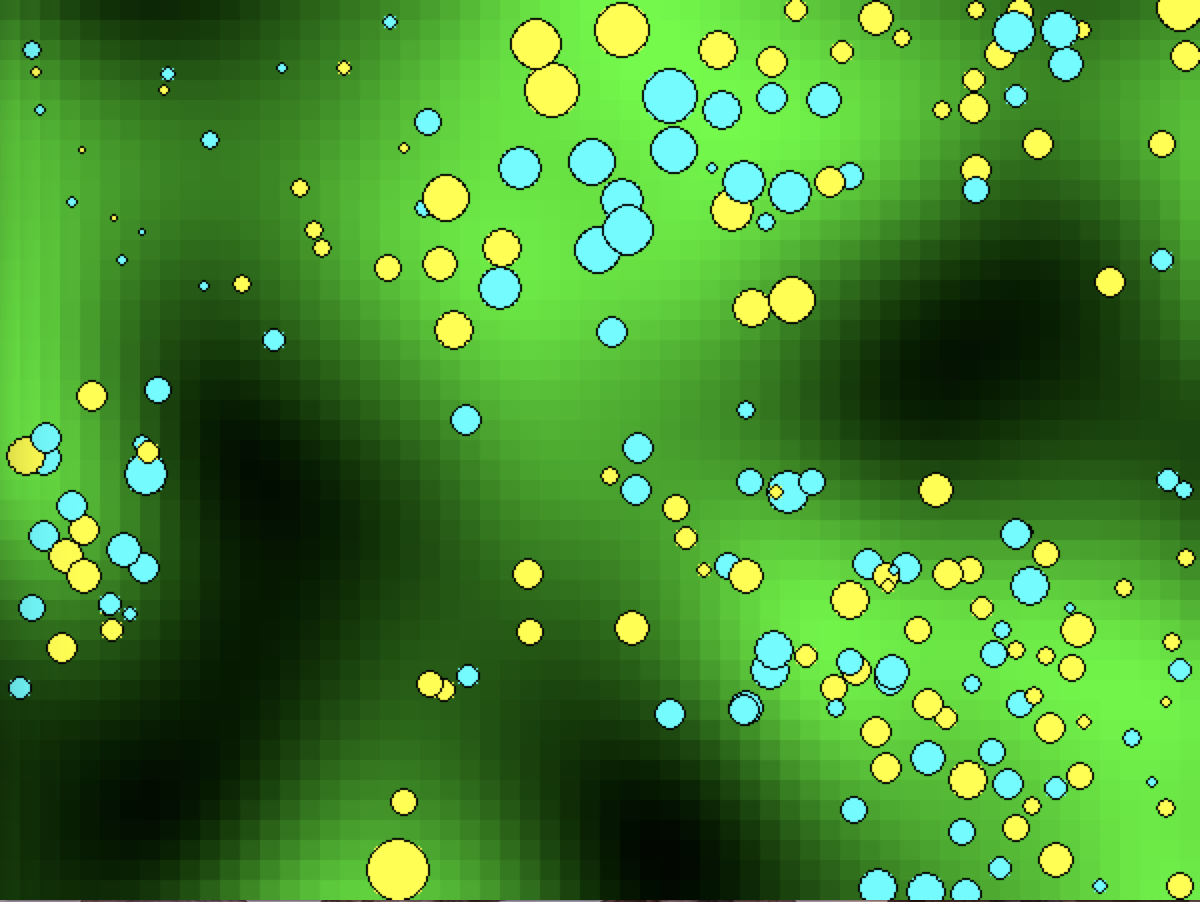
Image of an istant of the simulation considering food (1)
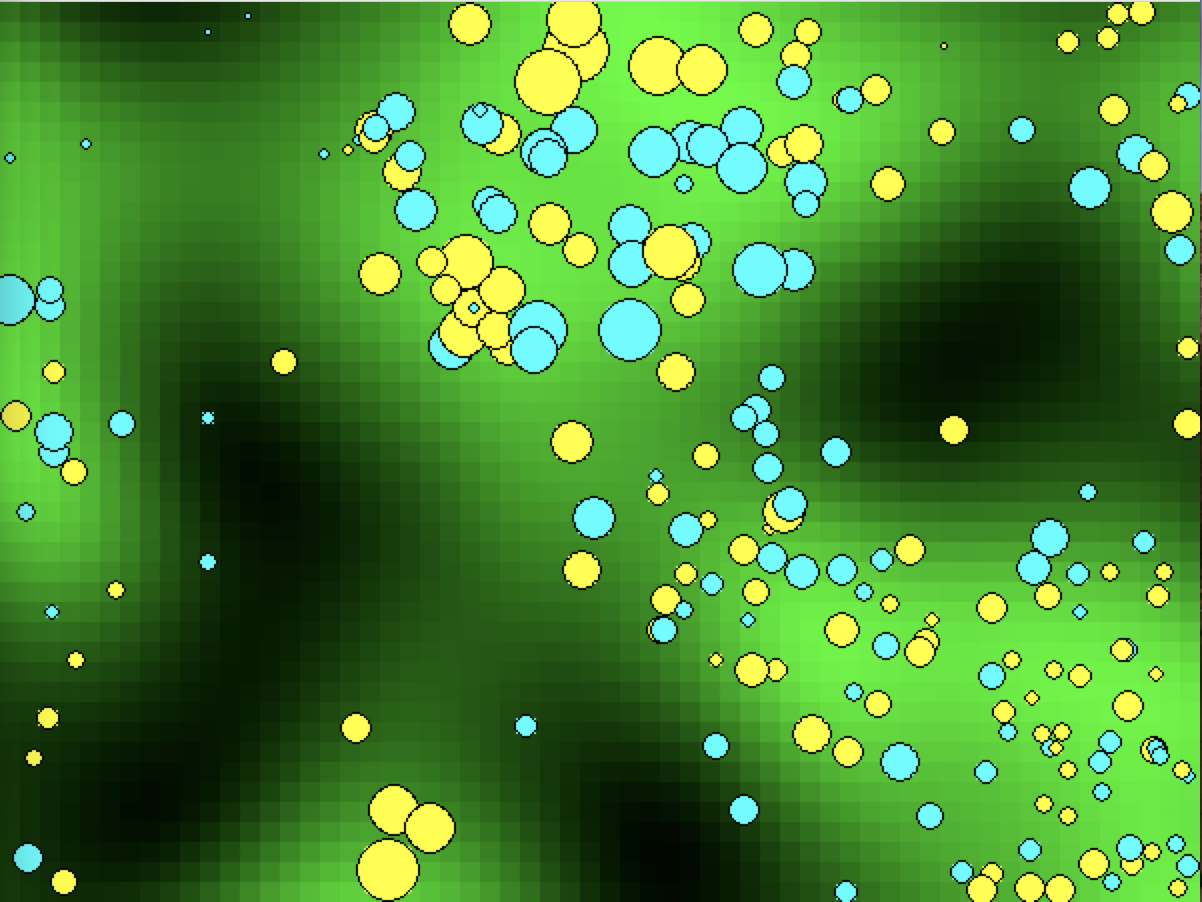
Image of an istant of the simulation considering food (2)
Demographic trend
Birth and death cycle
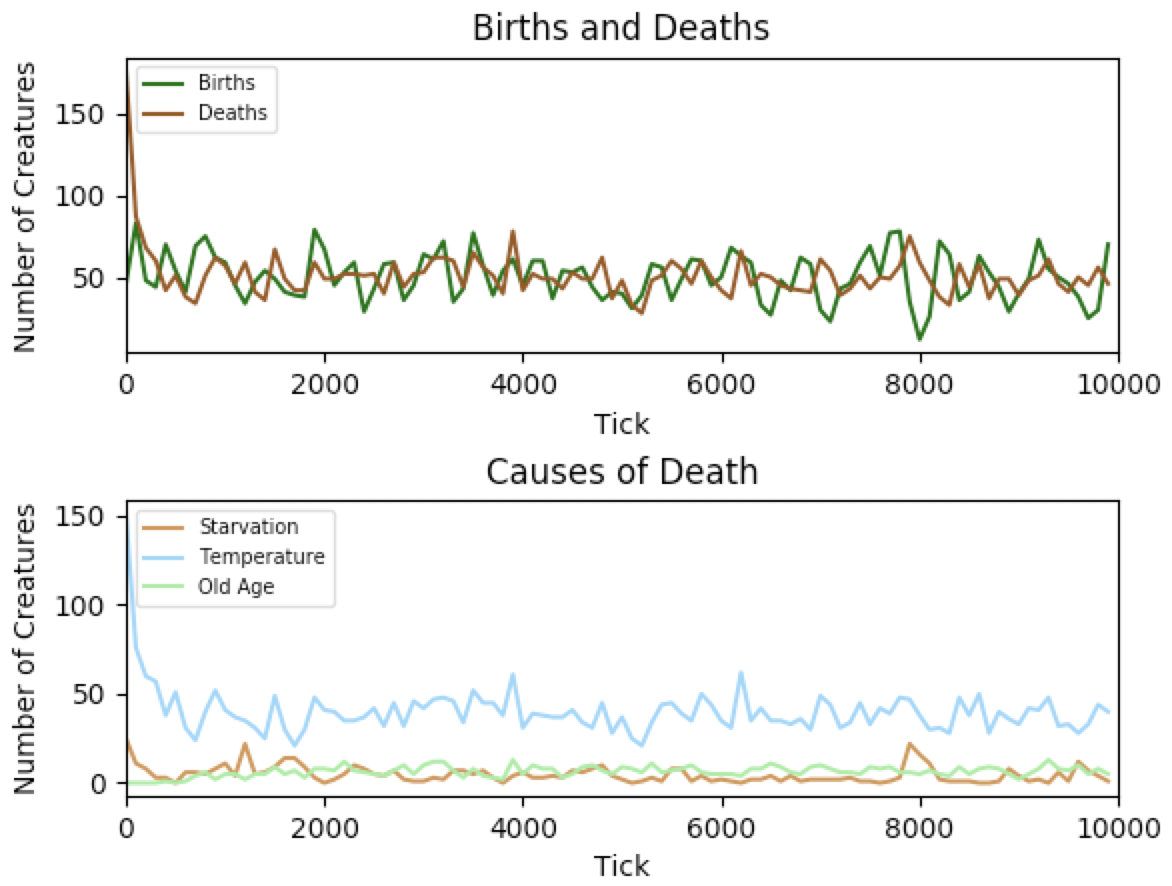
The population graph follows a sinusoidal trend with a creatures increase of about 100 organisms. There is a mechanism of auto-regulation that effects when there are less creatures than that world can sustain, causing many reproductions between creatures and an increase of population number. But, at this point, there are much more creatures than food availability, and we can observe a demographic fall. Then the cycle restarts.
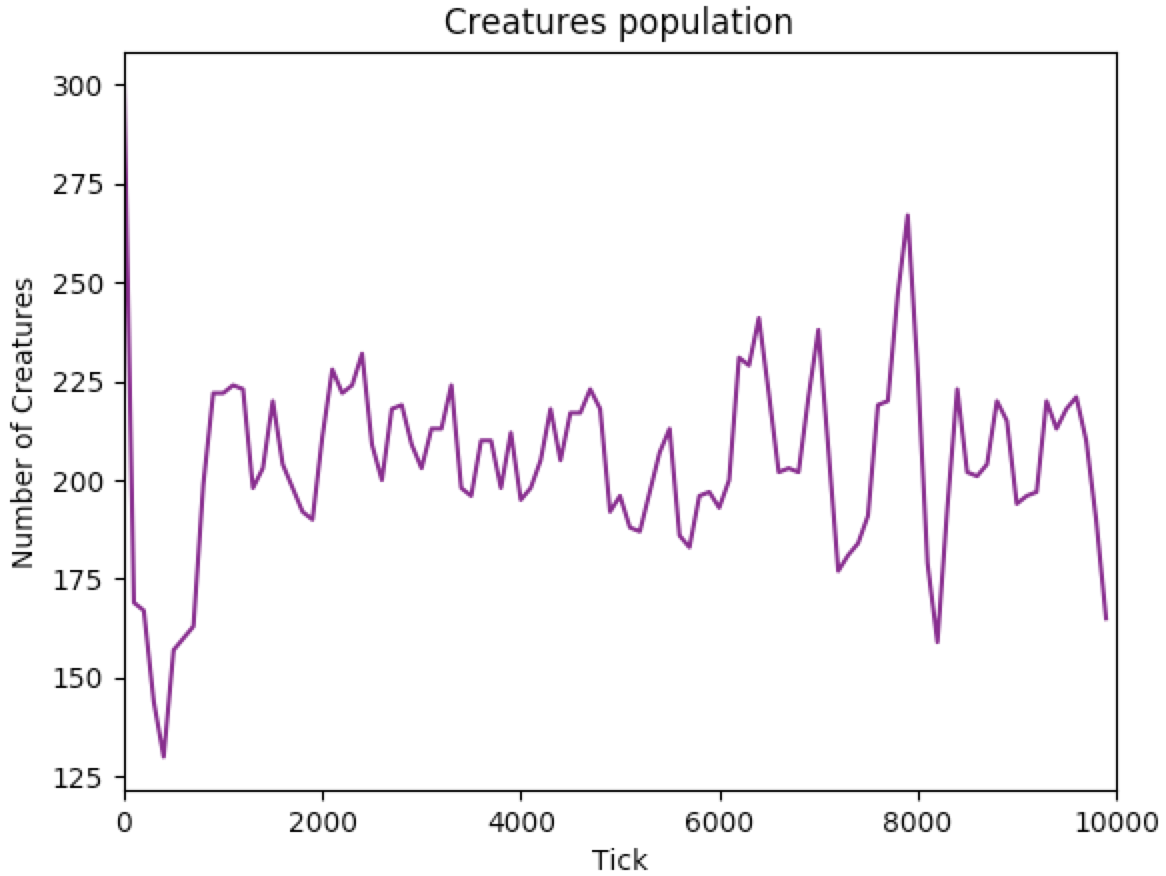
Demographic trend
